Debugging and scenarios
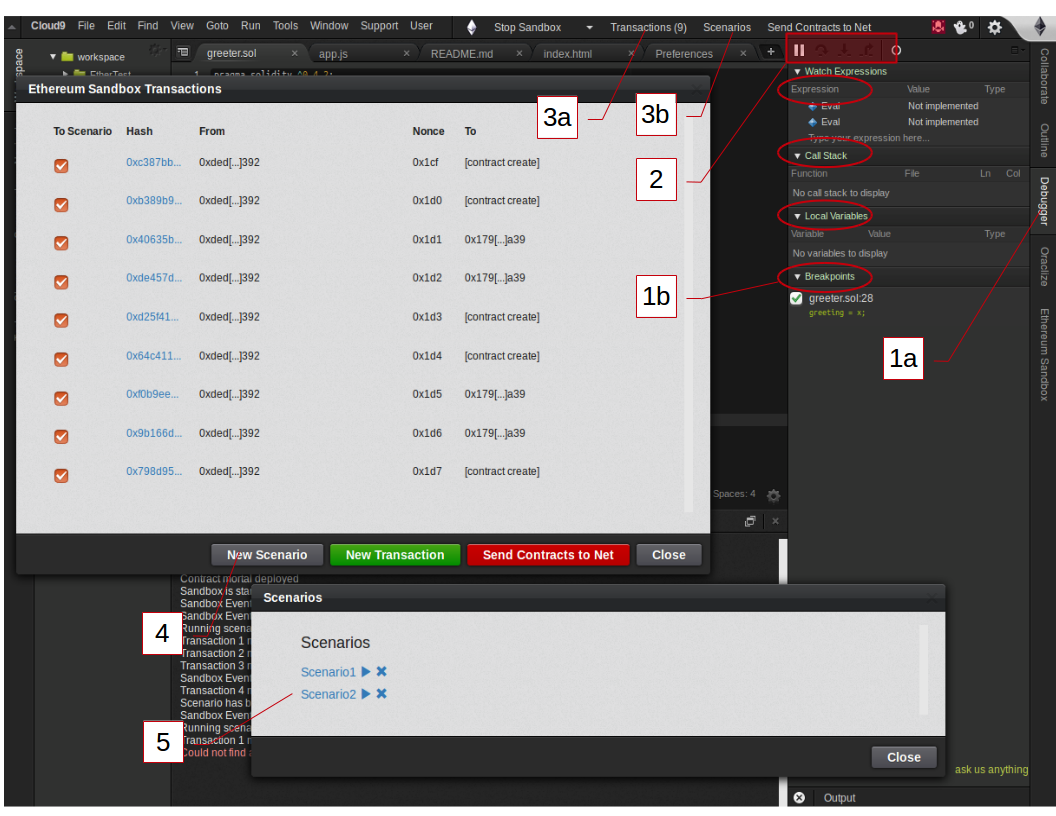
A new feature in Studio IDE is Solidity debugging , and running different Scenarios for fast efficient testing and debugging.
*Ethereum Studio IDE with Classic color scheme. (if you like it, you can use Cloud9/preferences in menu to change your theme)

[1a], [1b], [2]: The debugger tab and setting breakpoints
Watch Expressions:
not yet implemented.. check back often
Call stacks:
See your selected local variable breakpoint state.
Local variables:
In the solidity code right click the variables you want to monitor and watch it in the debugging Breakpoint tab [1b]
Breakpoints:
Set break points in your solidity code by clicking to the left of the line numbers in your Solidity code text editor.
Step through your code [2], line by line, and observe state changes, local variable assignments and more.
[3a], [3b], [4] and [5]: Check your transactions and run different scenarios
When you run your solidity code and transactions, the IDE keeps a log which you view by clicking the transactions link [3a] at the top right of your screen.
The Ethereum Sandbox Transactions pop up window shows youa log of the recent transcations. You can select which ones you want to add to a scenario for re-testing by clicking the checkbox left of each transaction then click new scenario [4].
Now when you select the Scenarios menu item [3b], the Scenarios pop up shows your scenario on the list ready to run again for debugging and testing.
was this useful to you? you can donate ethers to 0x44cd5bb33b14e2d12bb2e3cd4428d8238dd0ecf1